01 / 06
Live sensor monitoring
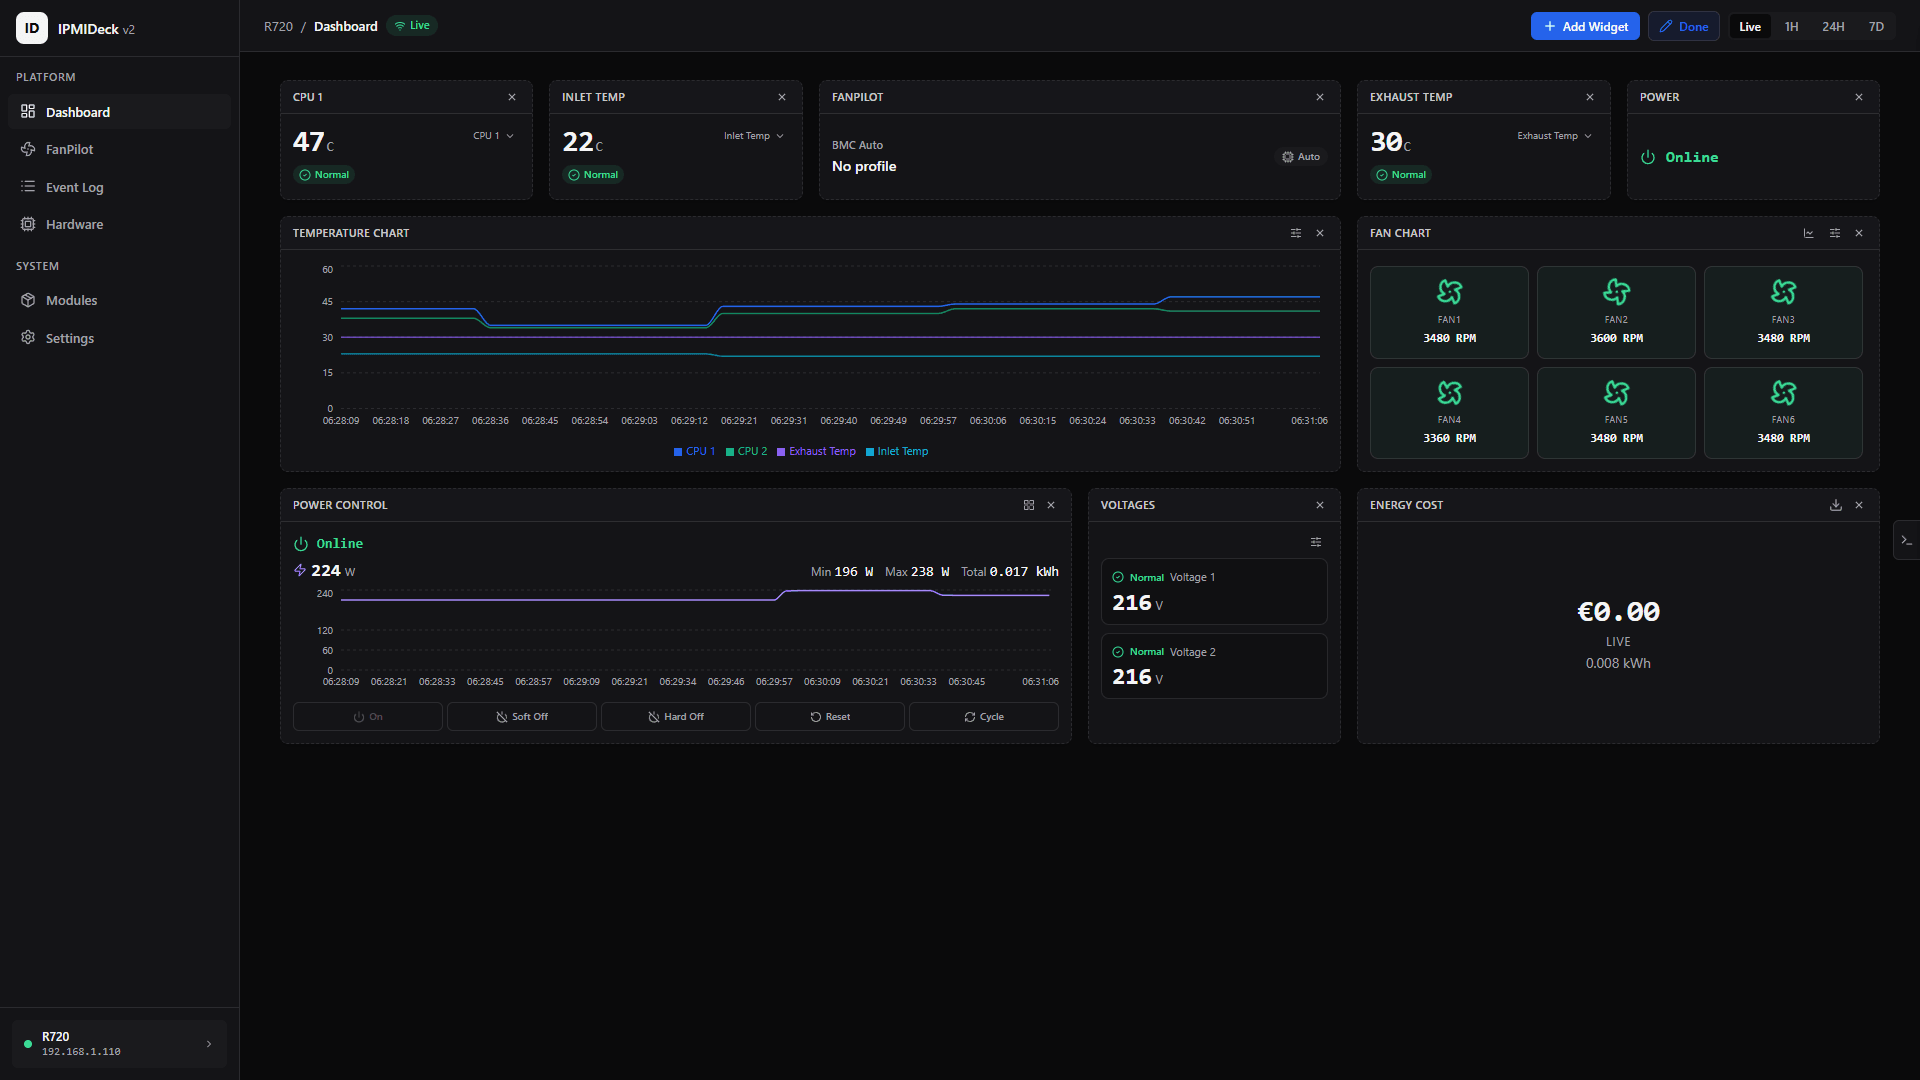
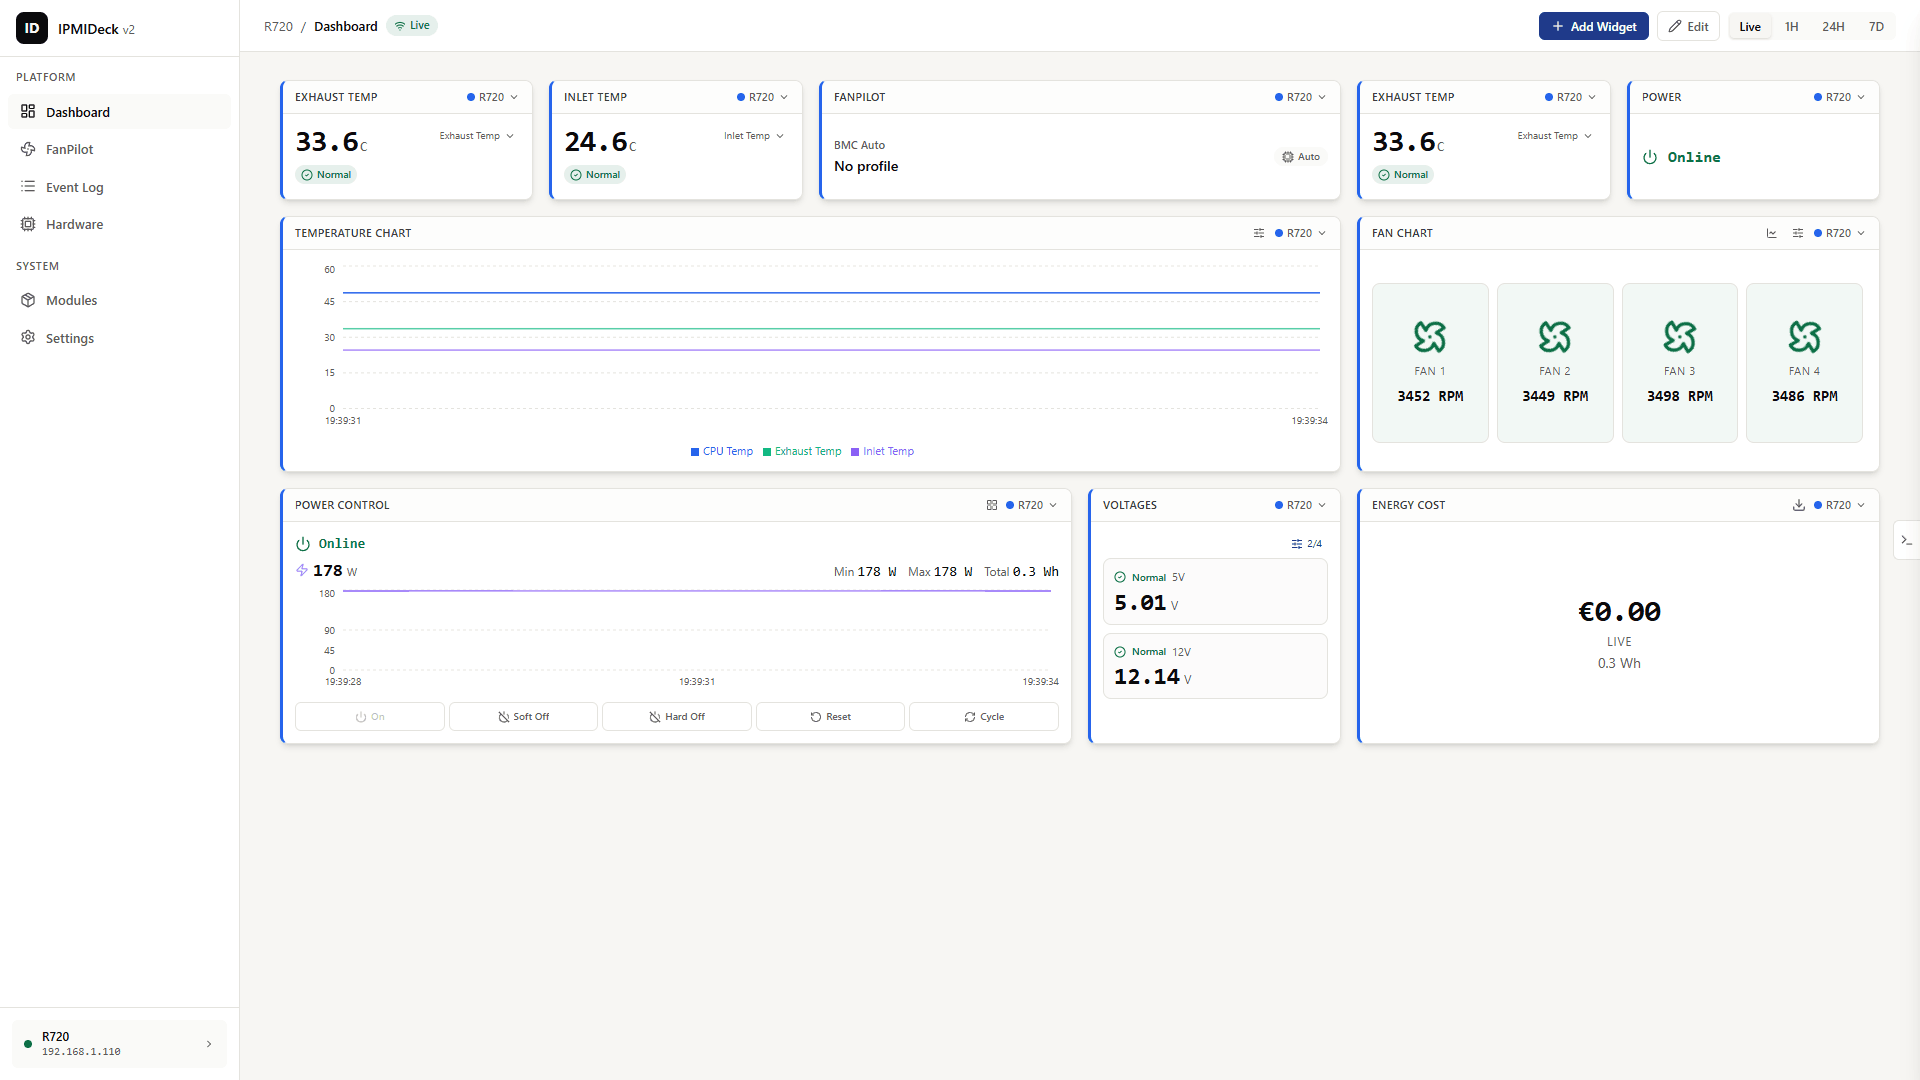
Inlet, CPU and exhaust temps, fan RPM, voltage and live power draw, streamed from the BMC onto a rolling history. Alert thresholds turn the numbers into signal.
LiveTEMP
FanRPM
Window24h
Explore every pillar
IPMIDeck turns raw IPMI 2.0 into a fast, legible control surface. Here is each pillar in depth: what it shows, what it controls, and why it replaces the vendor web UI.
Inlet, CPU and exhaust temps, fan RPM, voltage and live power draw, streamed from the BMC onto a rolling history. Alert thresholds turn the numbers into signal.
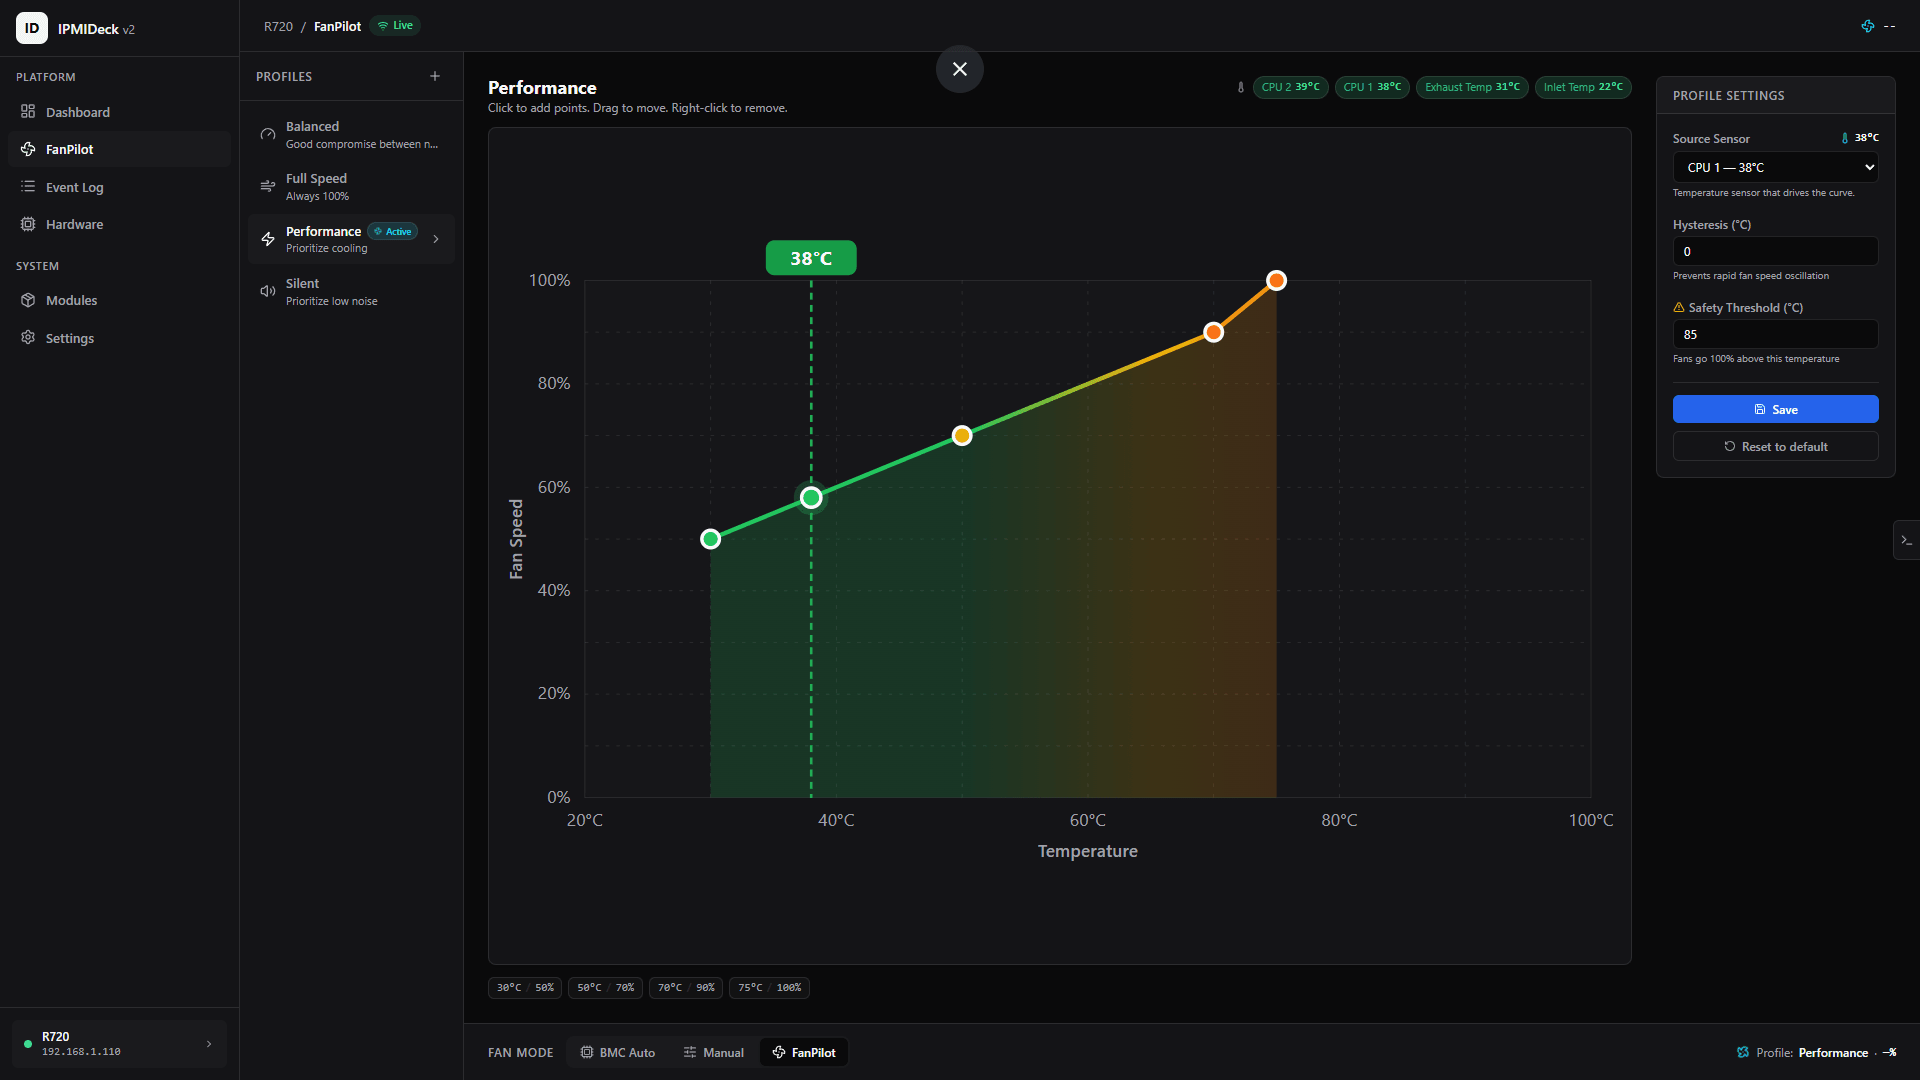
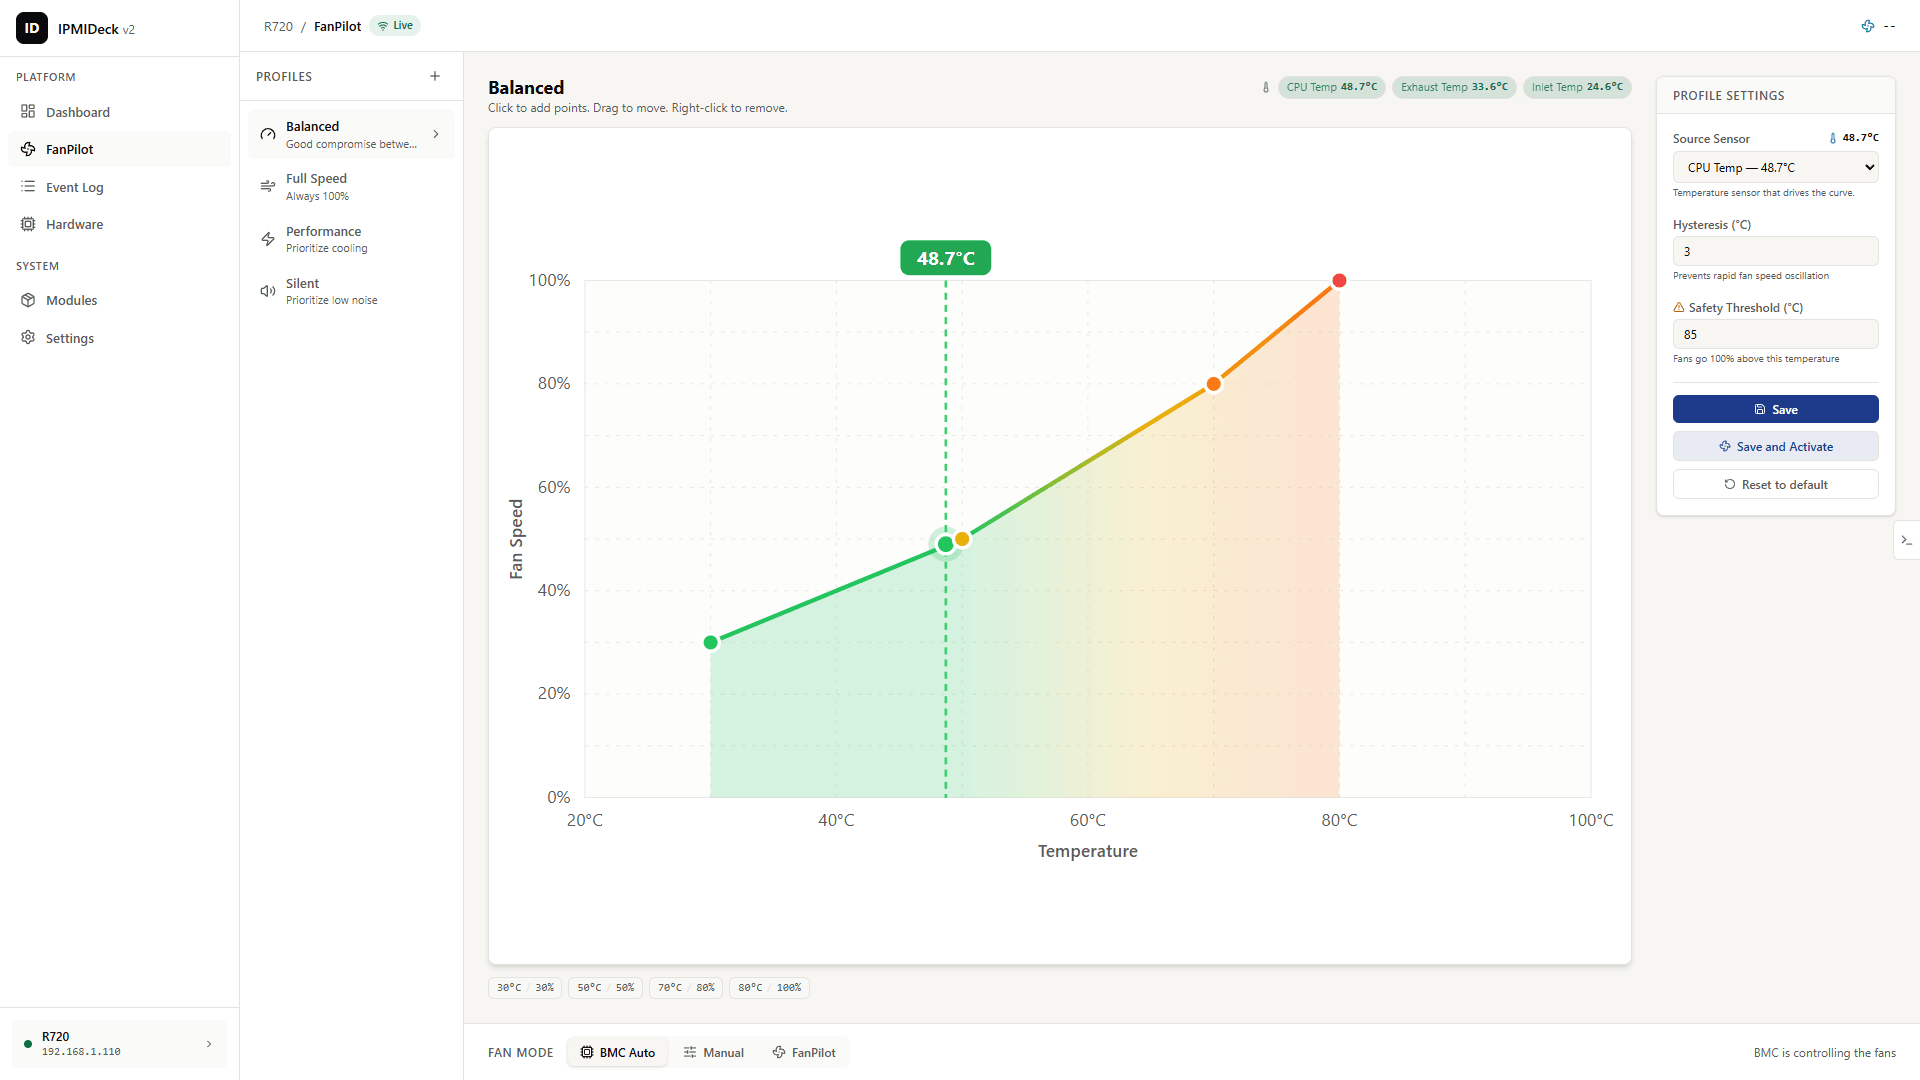
Drag control points over a live temperature line and tune hysteresis. A hardware override forces fans to 100% above the critical temperature. Your curve can never beat it.
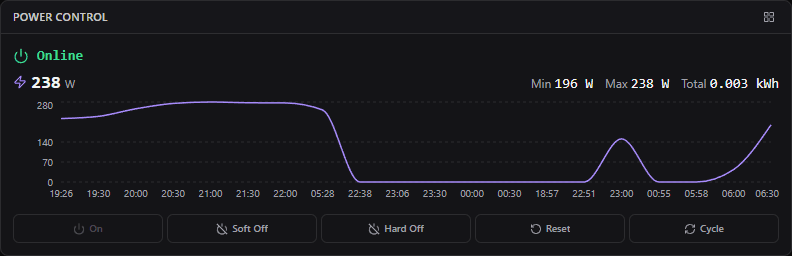
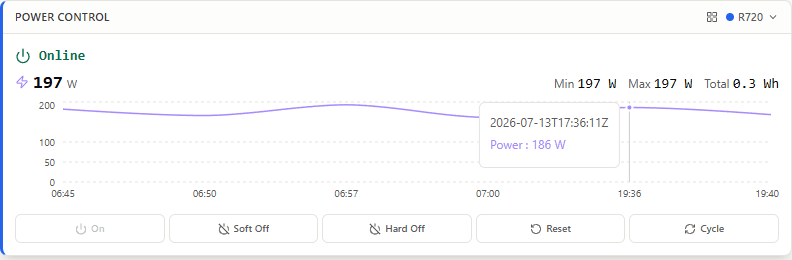
Confirmed On, Soft Off, Hard Off, Reset and Cycle, with a live power-draw graph and running cost. Every command is explicit, confirmed before it fires, and logged.
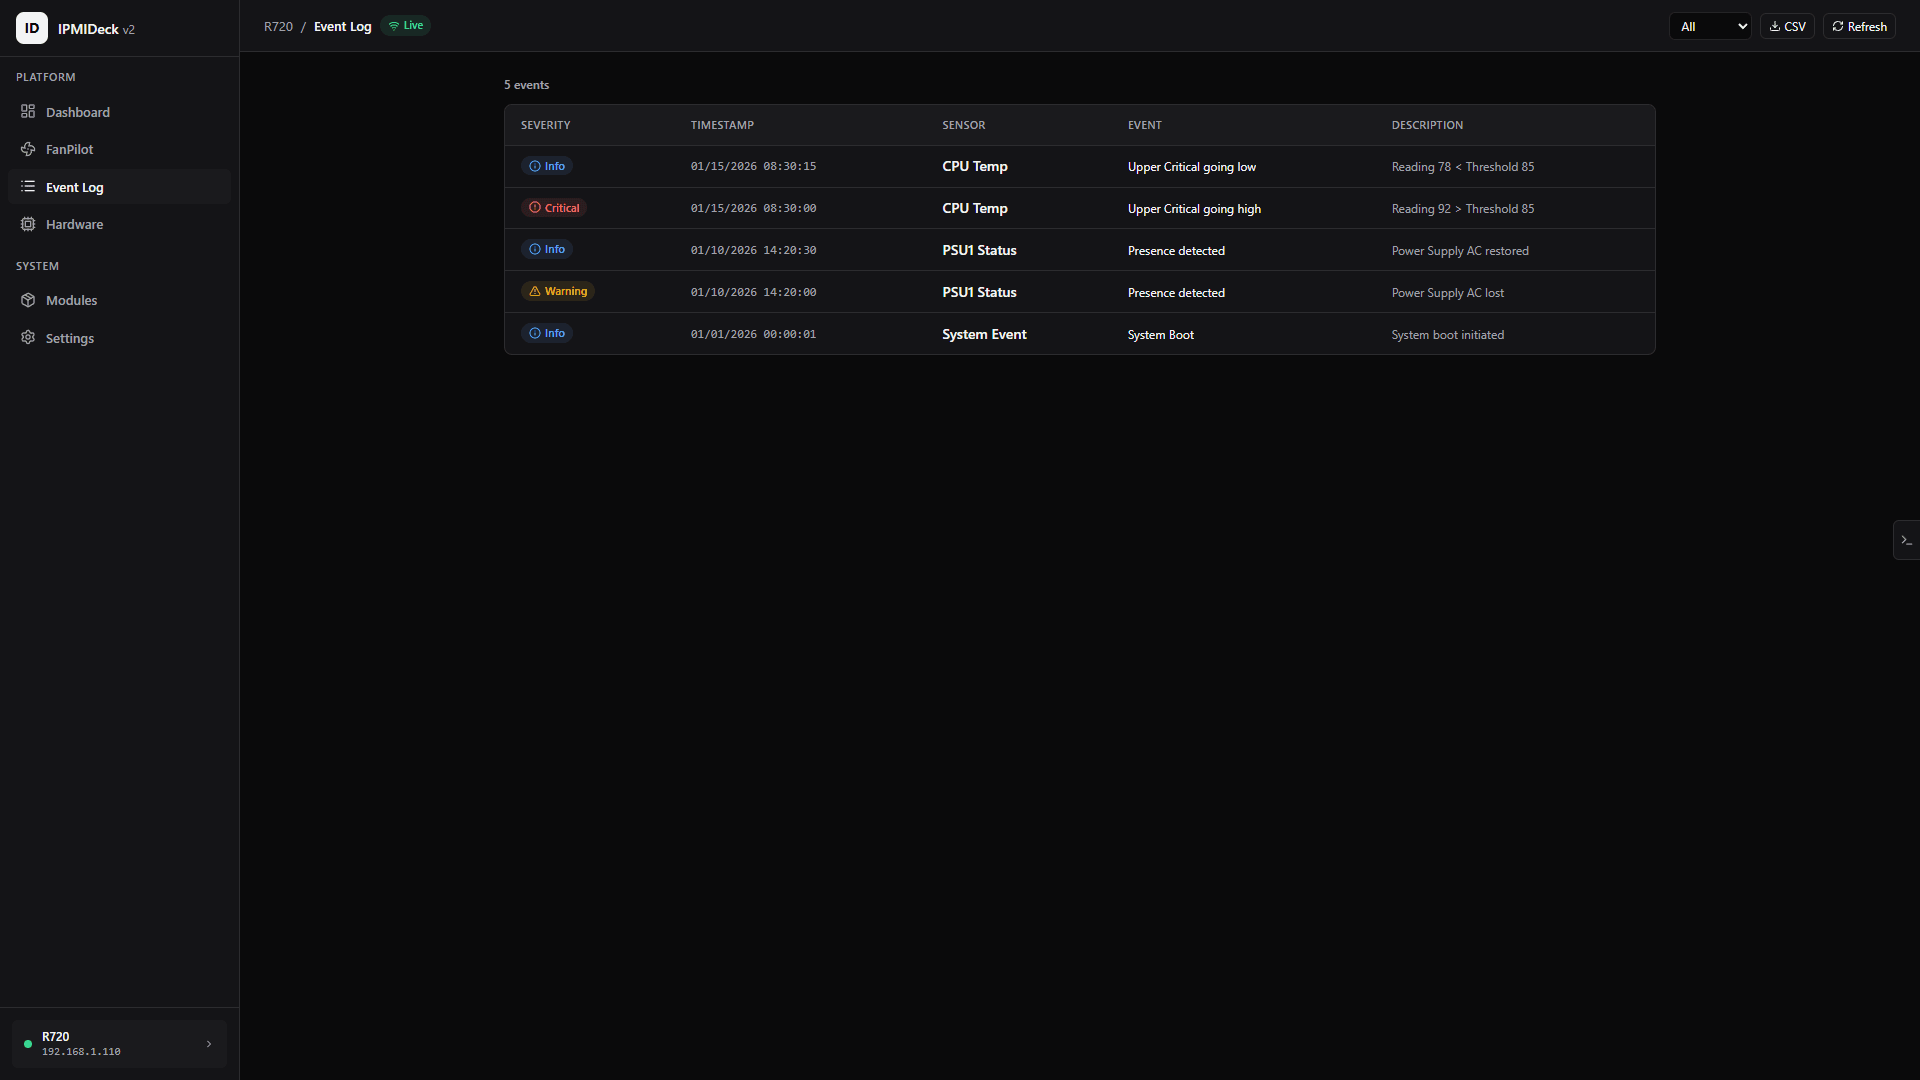
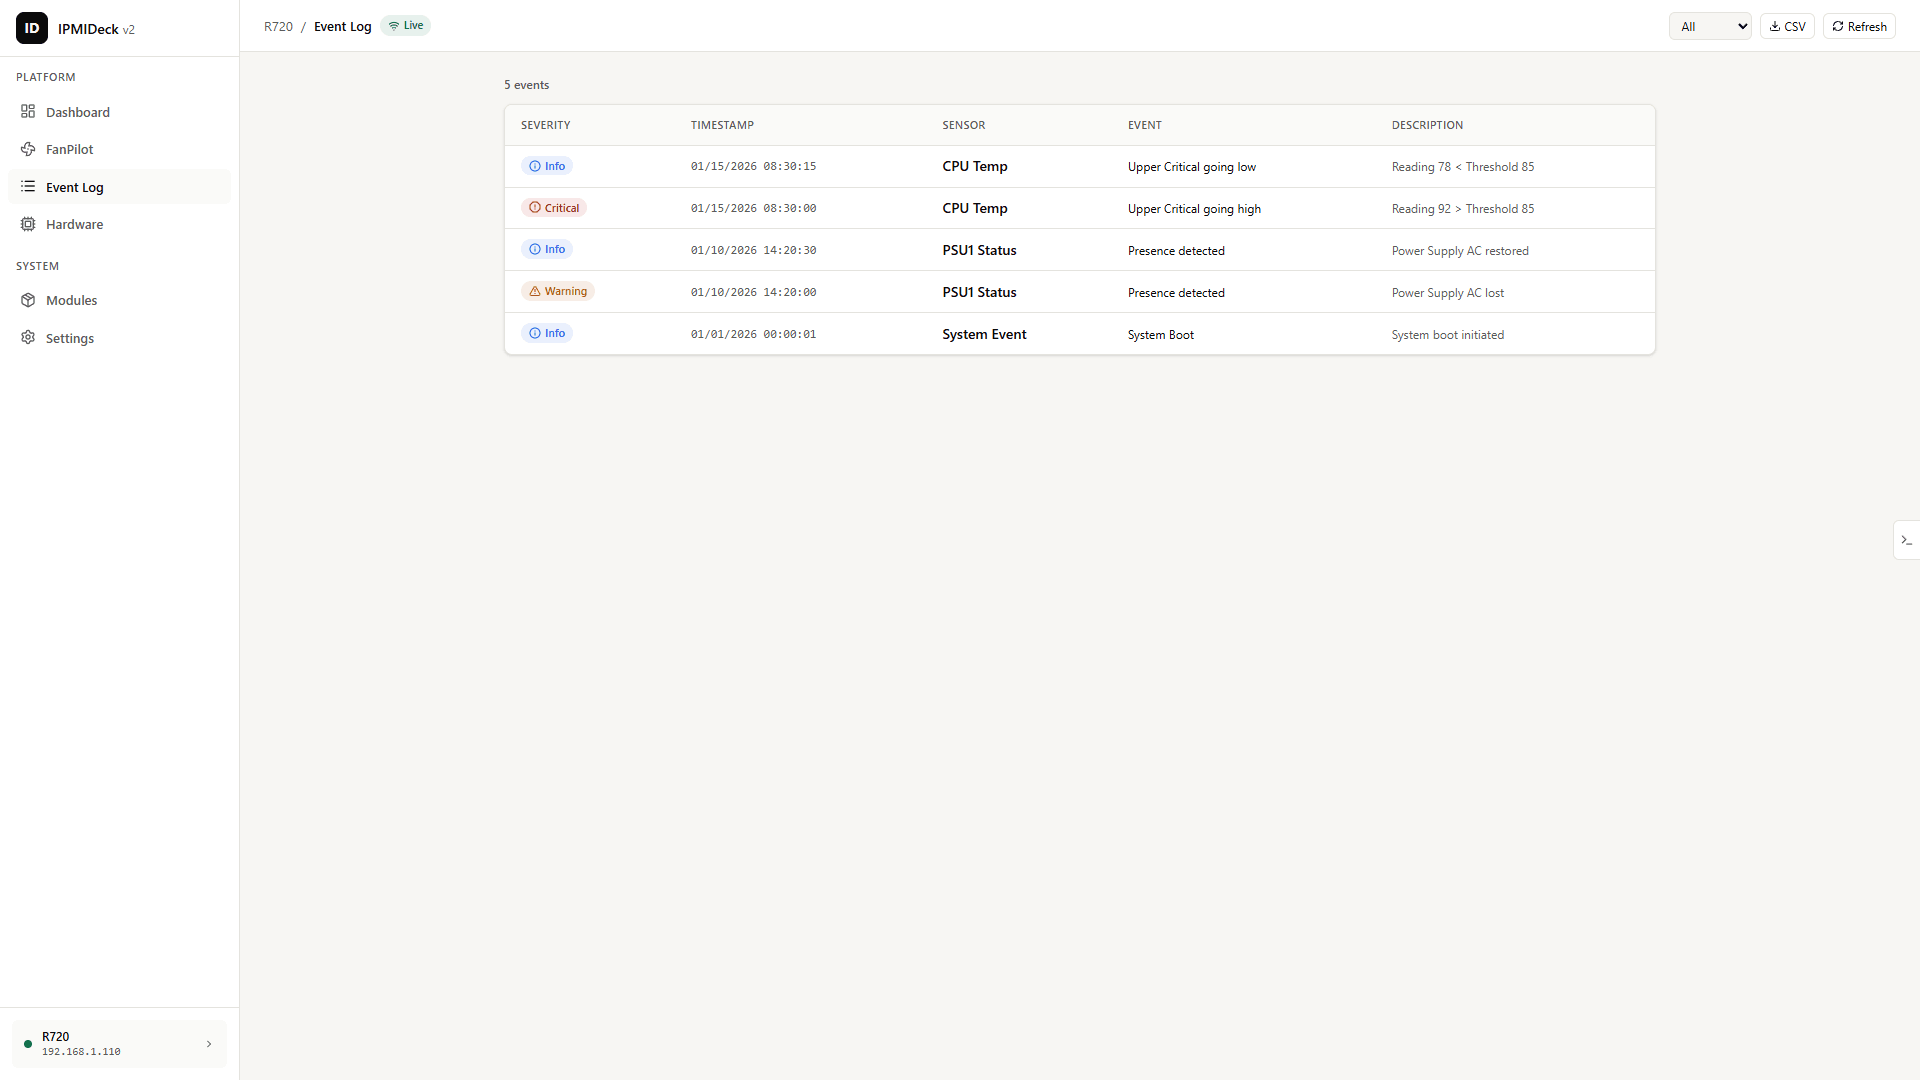
Read the full event log with severity badges, search and date filters, then export the filtered view to CSV or JSON for a ticket or an audit trail.
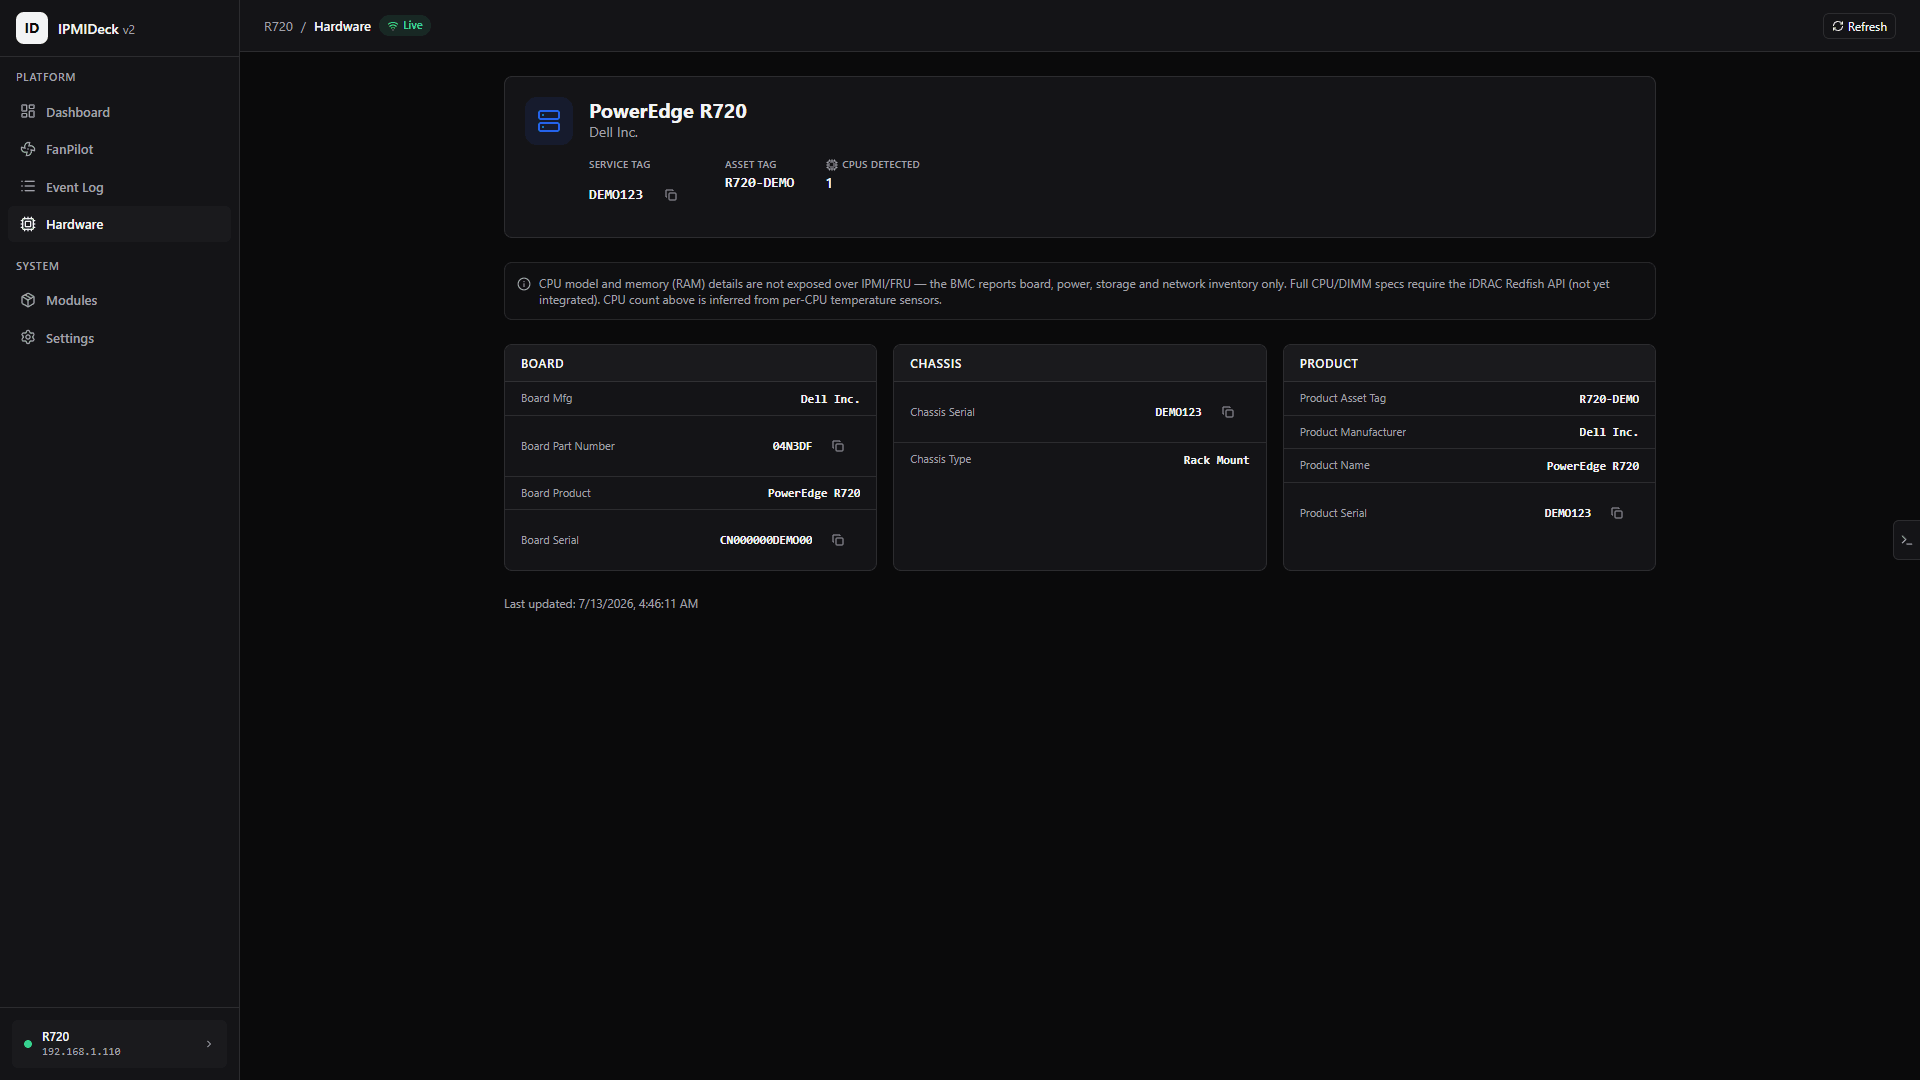
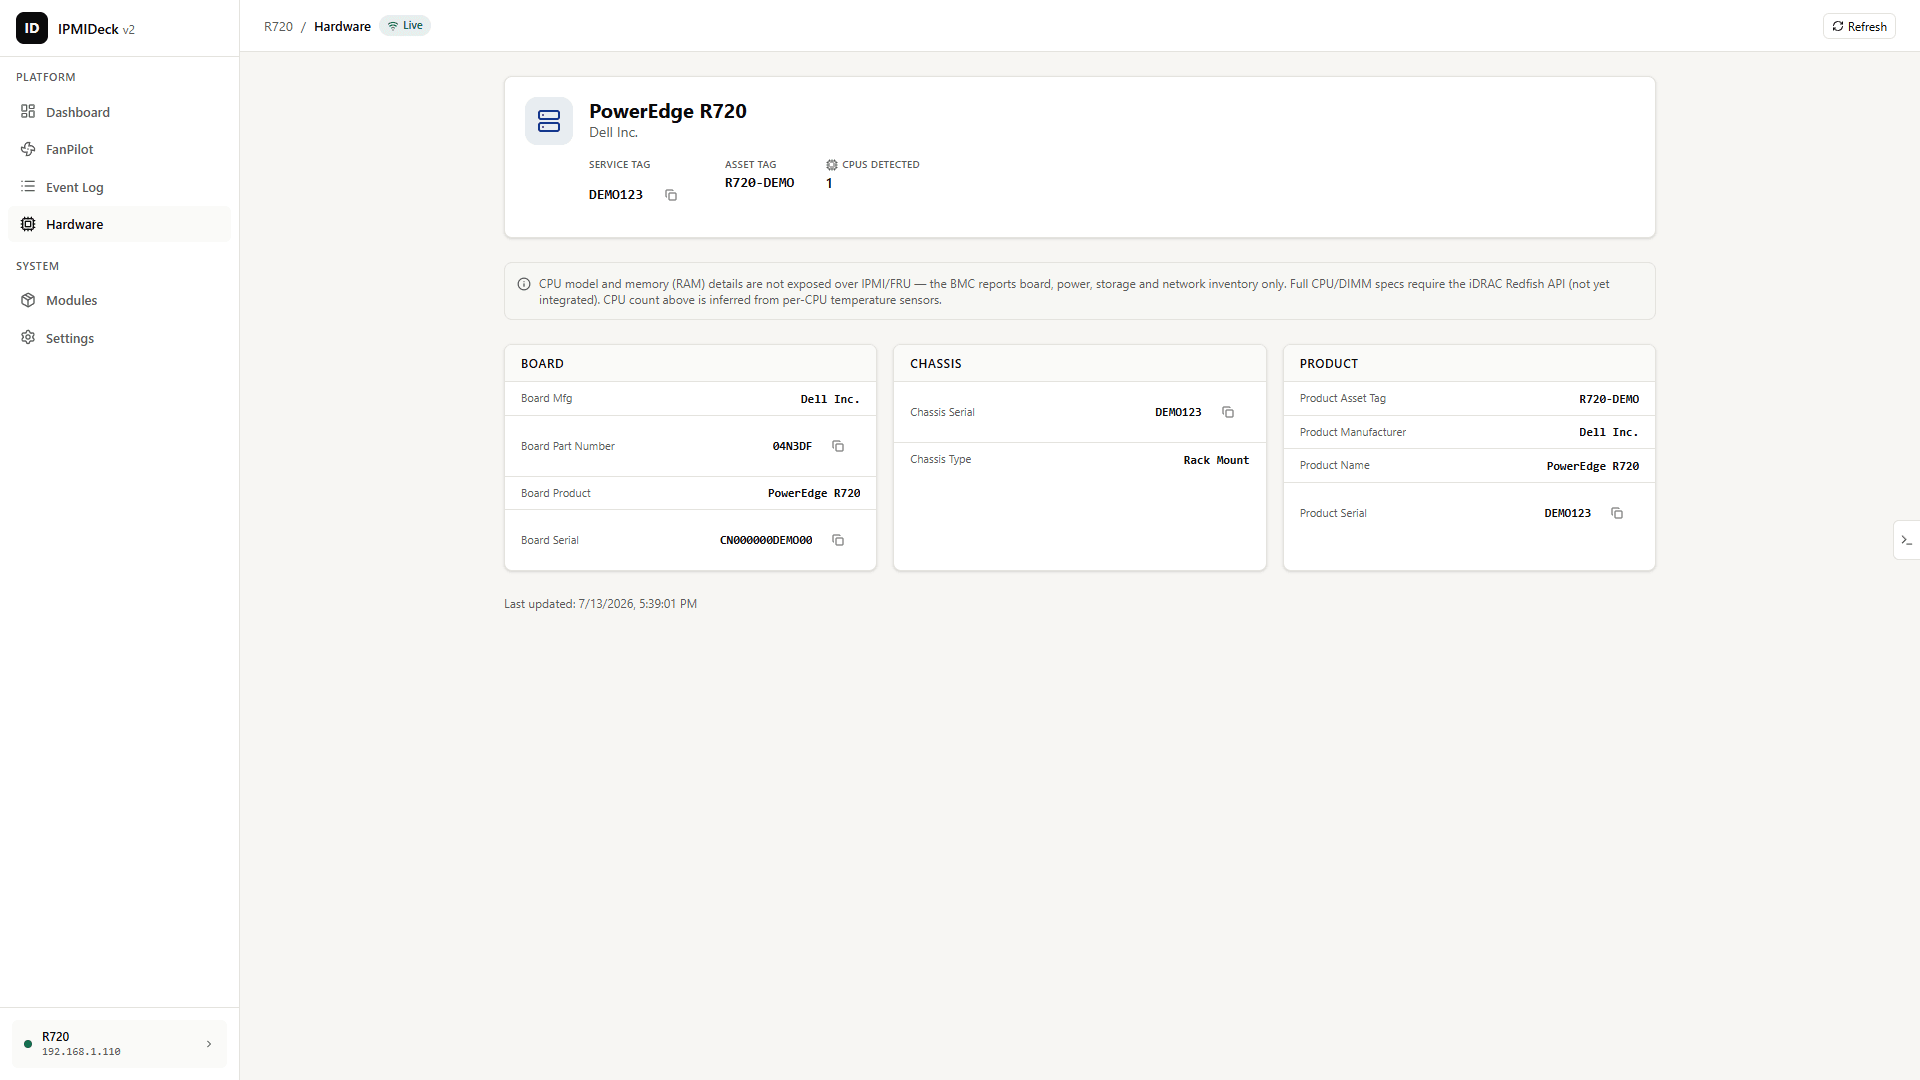
Manufacturer, product, part and serial numbers pulled straight from FRU into one clean system summary. No on-site label check, no vendor spreadsheet.
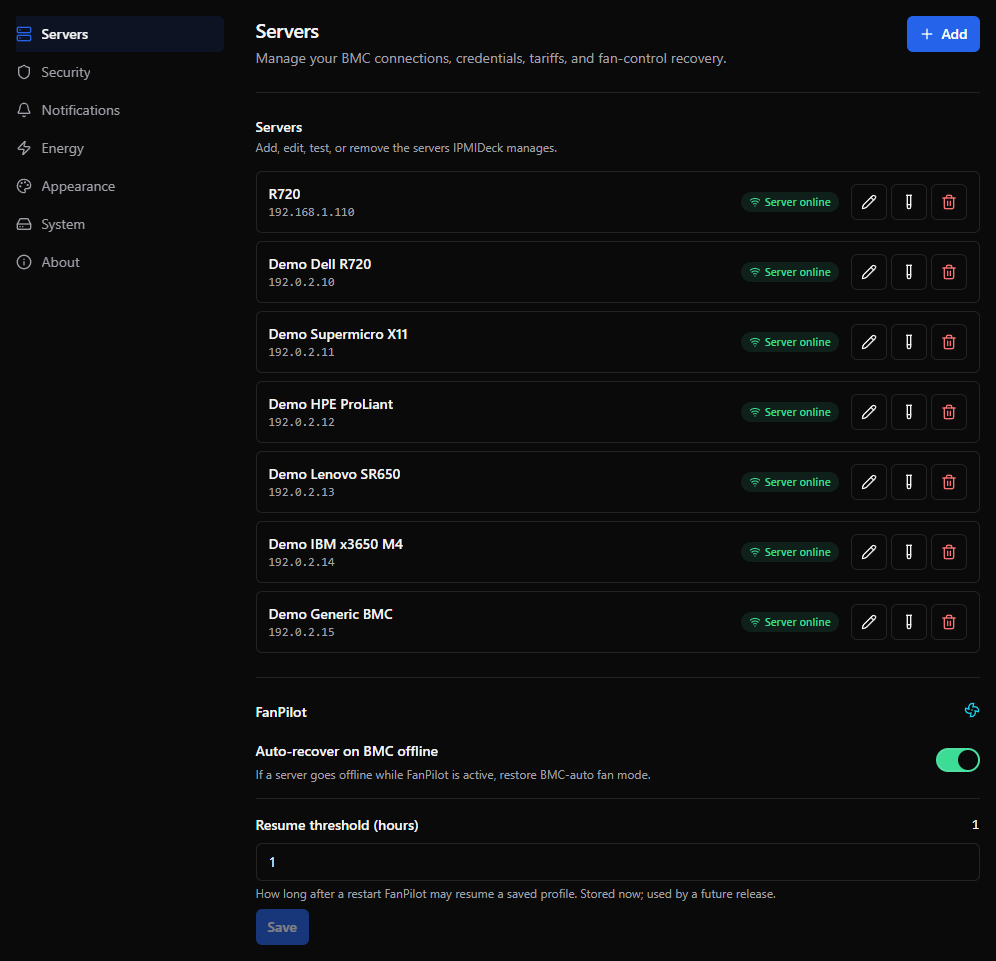
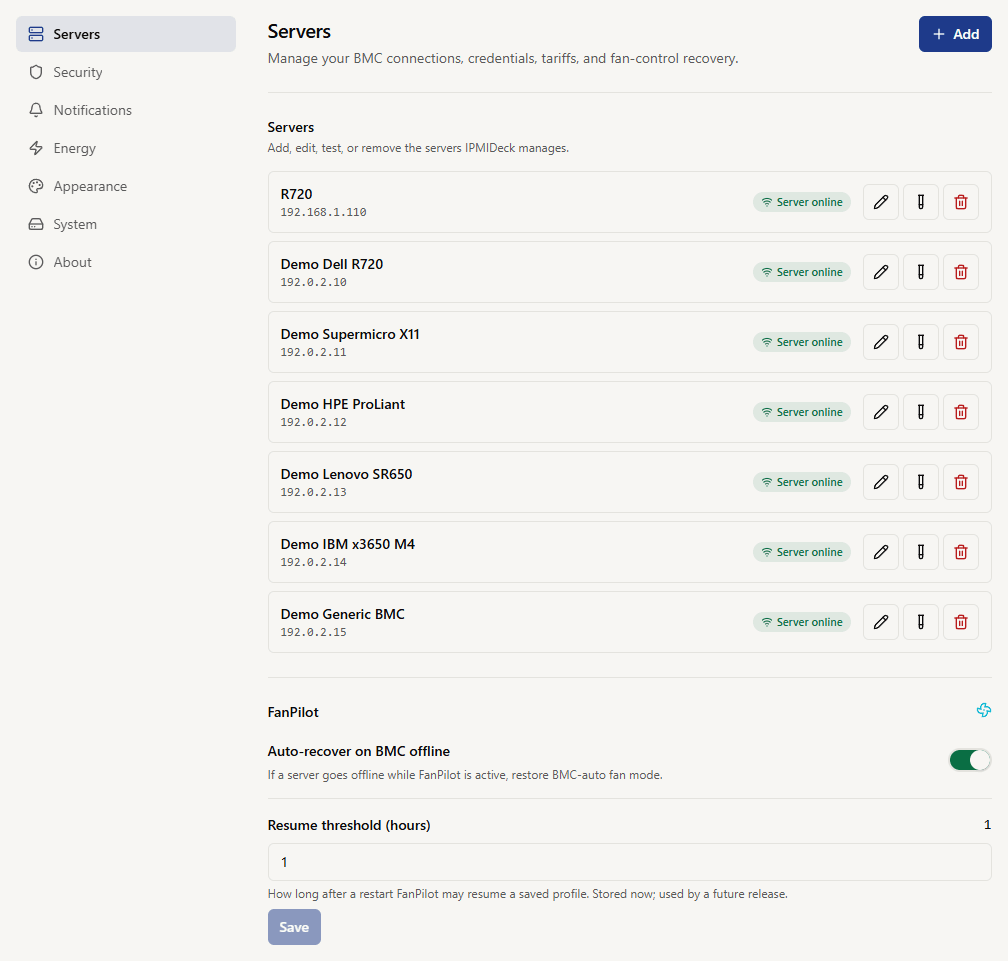
One instance manages many BMCs (Dell PowerEdge, Supermicro, HPE iLO, Lenovo XCC) over standard IPMI 2.0, switched from a single dropdown.